Tube Rank: Your Guide to Video Success
Discover tips and insights for optimizing your video presence.
Seeing is Believing: Why Data Visualization Software is Your Best Friend
Unlock the power of data! Discover why data visualization software is your ultimate ally for transforming numbers into insights.
The Power of Visualizing Data: Transforming Numbers into Insights
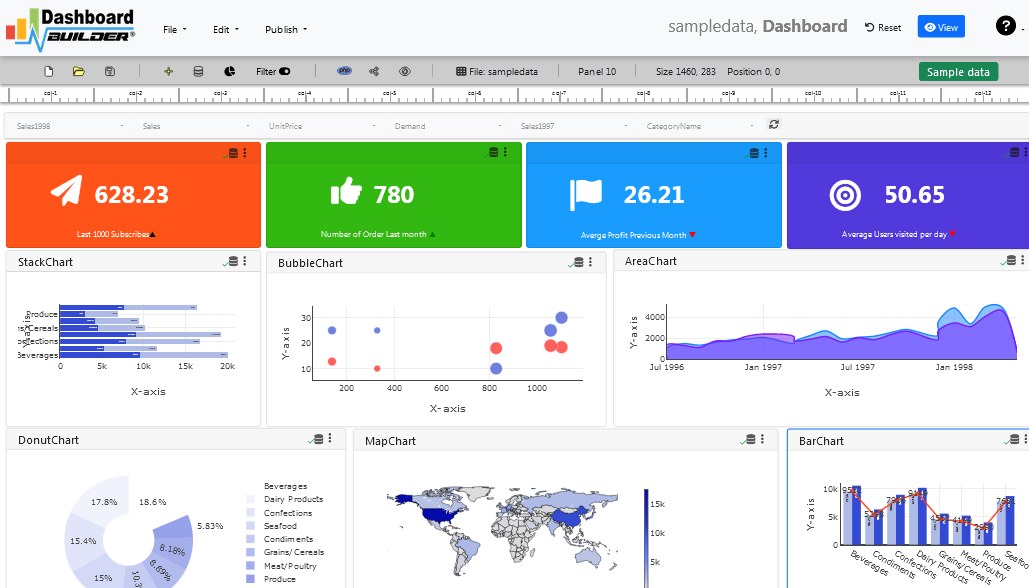
The power of visualizing data lies in its ability to transform seemingly lifeless numbers into meaningful insights. By representing data through visualization techniques such as charts, graphs, and maps, we can simplify complex information, making it more accessible and easier to understand. For instance, a well-designed bar chart can effectively convey trends and comparisons that would be laborious to interpret from a spreadsheet filled with raw data. This transformation not only enhances comprehension but also aids in decision-making processes, allowing stakeholders to identify patterns and anomalies they might have otherwise overlooked.
Moreover, research suggests that people retain visual information significantly better than text-based information, making data visualization an essential tool for communication. When presenting analysis to audiences, consider incorporating a variety of visualization types to cater to different learning styles. Infographics, pie charts, and scatter plots can engage viewers and keep their attention while delivering critical data. By prioritizing data visualization in your reporting and presentations, you not only elevate your content but also empower your audience to draw their own conclusions from the insights presented.

Top 5 Data Visualization Tools You Need to Know About
Data visualization tools are essential for converting complex datasets into easily understandable visuals. They help professionals from various industries make informed decisions based on data-driven insights. Here, we explore the Top 5 Data Visualization Tools you need to know about:
- Tableau: Renowned for its powerful analytics capabilities, Tableau allows users to create stunning visualizations with ease. Its drag-and-drop interface is user-friendly, making it suitable for both beginners and advanced users.
- Power BI: Microsoft’s Power BI offers robust reporting and visualization services. Integrating seamlessly with other Microsoft services, it is ideal for businesses already entrenched in the Microsoft ecosystem.
- Google Data Studio: This free tool enables users to create interactive dashboards and reports. Its collaboration features allow teams to work together in real-time, making it a popular choice for businesses.
- Looker: Looker specializes in data analytics and business intelligence. Its unique approach to data modeling allows organizations to create customized dashboards tailored to specific needs.
- D3.js: For those with coding skills, D3.js provides an incredible level of customization. As a JavaScript library, it allows developers to manipulate documents based on data and create complex visualizations with precise control.
How Does Data Visualization Enhance Decision-Making?
Data visualization plays a critical role in enhancing decision-making by transforming complex datasets into visually accessible formats. Instead of sifting through endless rows of numbers, stakeholders can quickly interpret trends and patterns through graphs, charts, and maps. For instance, a bar chart depicting sales figures over several quarters allows decision-makers to identify peak performance periods at a glance. The use of color-coded indicators, such as heat maps, can further highlight areas requiring immediate attention, making it easier for teams to focus their efforts where they matter most.
Moreover, effective data visualization fosters a more collaborative environment by making information transparent and digestible for all team members. When individuals can easily grasp visual data, discussions become more informed and focused, leading to more robust strategies. As a result, organizations can react promptly to market changes and operational challenges. In short, leveraging data visualization not only enhances understanding but also empowers teams to make data-driven decisions that support long-term success.