Tube Rank: Your Guide to Video Success
Discover tips and insights for optimizing your video presence.
Visualize This: Transforming Data into Stunning Stories
Unlock the power of data storytelling! Discover how to transform complex data into stunning visuals that captivate and engage your audience.
Unlocking the Power of Data Visualization: Key Techniques Explained
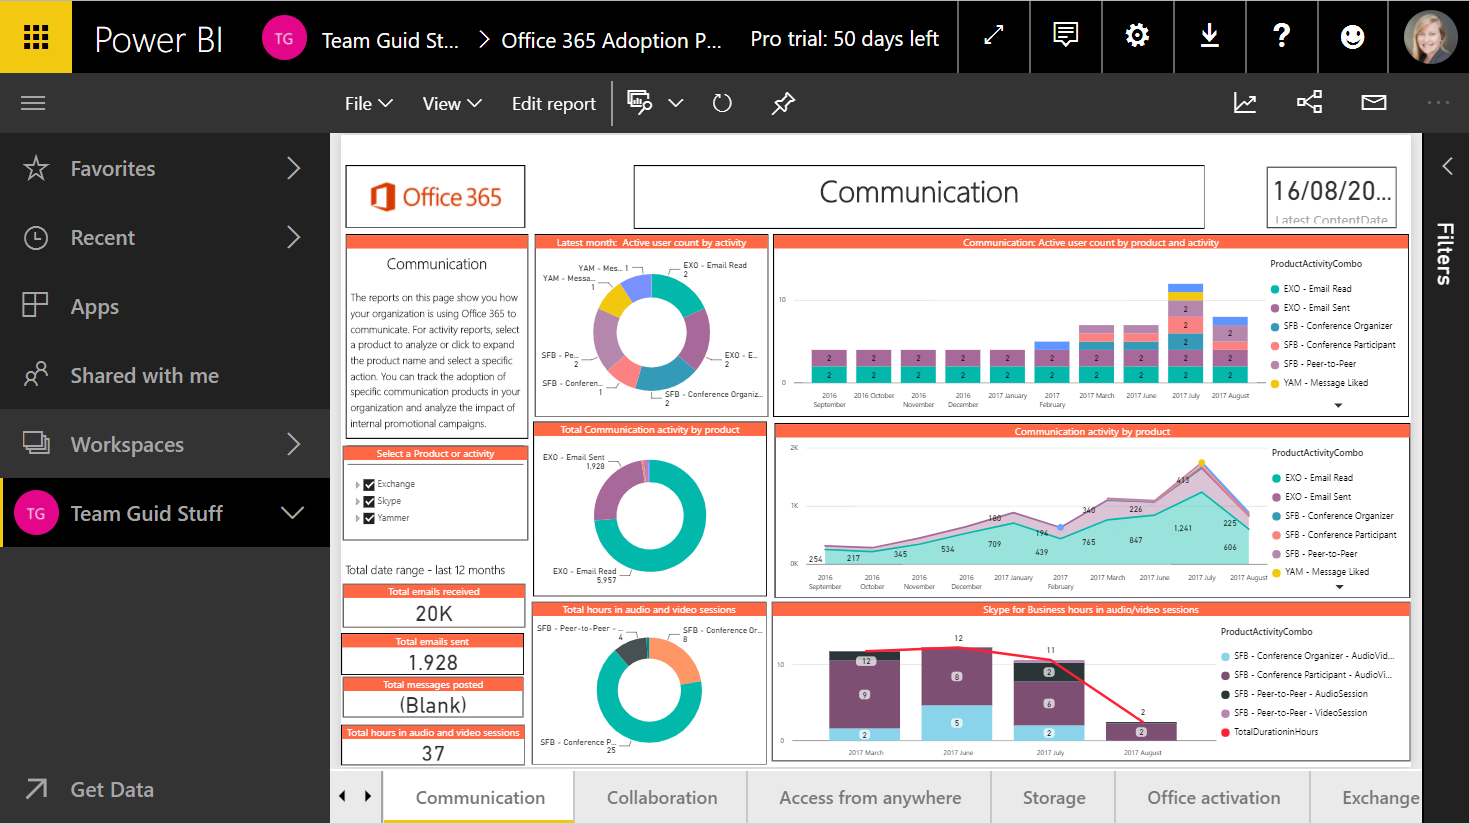
Data visualization is a powerful tool that allows us to translate complex datasets into easily digestible formats. By leveraging visual elements such as charts, graphs, and maps, data visualization enables us to uncover patterns and trends that might otherwise remain hidden. Key techniques to effectively visualize data include the use of color contrasts to highlight differences, labels for clarity, and interactive dashboards that facilitate user engagement. Each of these techniques plays a crucial role in making your data storytelling more impactful and accessible.
One of the most effective methods is to utilize infographics, which blend visuals with text to convey messages succinctly. Another technique is employing heat maps which visually represent data through color gradients, helping identify areas of high and low density at a glance. Additionally, leveraging pie charts for showing percentage distributions can provide quick insights into the data composition. By mastering these data visualization techniques, you can significantly enhance the way you present information, making it not only informative but also engaging for your audience.

How to Turn Raw Data into Compelling Visual Narratives
Turning raw data into compelling visual narratives is a crucial skill in today's data-driven world. Start by analyzing your data to identify the key insights that will resonate with your audience. Ask yourself questions like: What story does this data tell? What are the key takeaways? Once you have a clear understanding, you can design visual elements that effectively communicate those insights. Tools like charts, graphs, and infographics can transform mundane statistics into engaging visuals that captivate readers.
Next, consider the design principles that enhance your narrative. Use colors and fonts judiciously to create a cohesive look that aligns with your brand. Structure your visual narrative logically by starting with an introduction, presenting the data, and concluding with actionable insights. Remember to keep it simple; cluttered visuals can confuse rather than clarify. Incorporate interactive elements where possible, allowing users to explore the data on their own, thus deepening their engagement and understanding.
What Makes Effective Data Storytelling? Insights and Best Practices
Effective data storytelling is an art that combines data analysis with narrative techniques to convey insights in a compelling way. To achieve this, first understand your audience and tailor your message to resonate with them. Incorporating a strong narrative structure is essential; this means having a clear beginning, middle, and end. Starting with a hook that captures attention, followed by the data to support your story, and concluding with actionable insights can create a memorable experience for your audience.
Another key aspect of data storytelling is the use of visuals. Visual aids like graphs, charts, and infographics can simplify complex data, making it more digestible and engaging. Ensure that your visuals are not only aesthetically pleasing but also serve to enhance the narrative. Additionally, contextualizing your data with real-life examples or anecdotes can help bridge the gap between cold numbers and relatable insights, ultimately making your data storytelling more impactful.